population pyramids
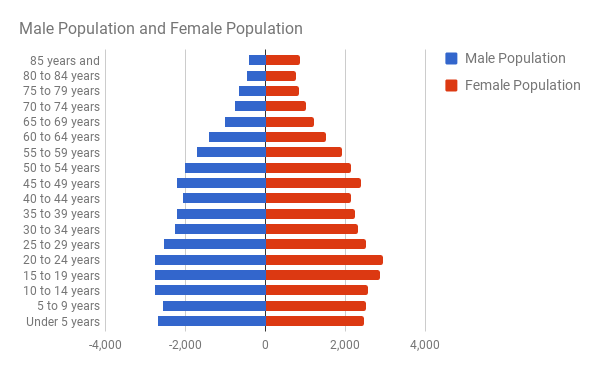
Turlock, CA: Turlock possesses a stable population in both older and younger groups. This is due to its rural location, good medical care, education, and warm climate. Mortality rates are low.
Modesto, CA: The trends for Modesto are very similar to Turlock except for the fact that Modesto appears to have slightly more individuals in the 50 year old region. This is probably due to the fact that many of these individuals are Bay Area transplants who might have commuted in the past to get to work. Mortality rates are very low here and population is quite stable.
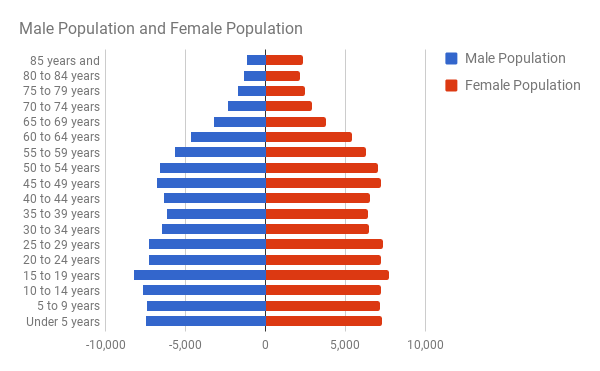
Sonora, CA: Sonora possesses a slightly boxy appearance that is probably due to the fact that many families grow up here, send their children to college, as accounted by the slight drop in the twenties, and then these children move back, as many people do in small, quiet communities.
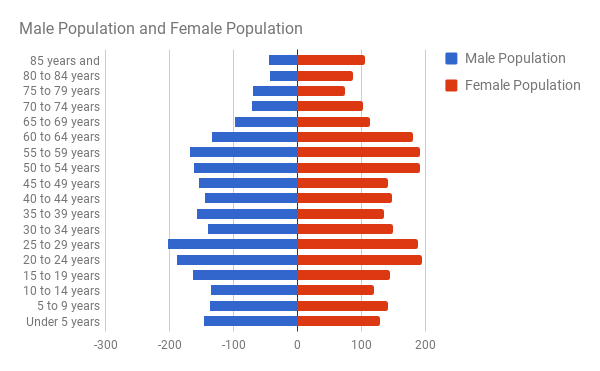
San Francisco, CA: San Francisco possesses a large amount of middle-aged individuals, but a small amount of young ones. This is probably due to the fact that most San Franciscans are single or married couples with one or two children, accounting for such values. The Bay Area has always been a region with lots of jobs for construction and technology. Such an infrastructure does not support large families well.
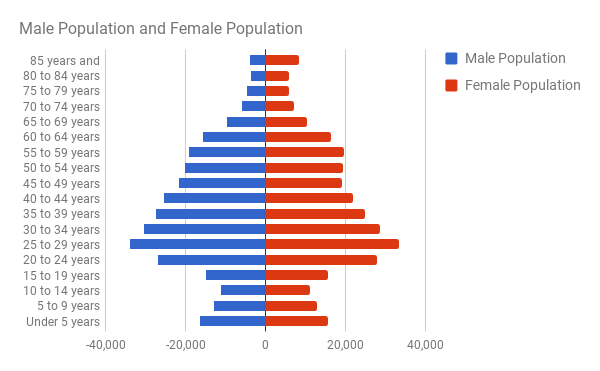
Seattle, WA: Seattle possesses the same trends as San Francisco in that it has large amounts of individuals in the middle-aged group, but few among the younger ages. This is due to large infrastructure and urbanization which are not generally fit for large families as well as they are for college students and workers.
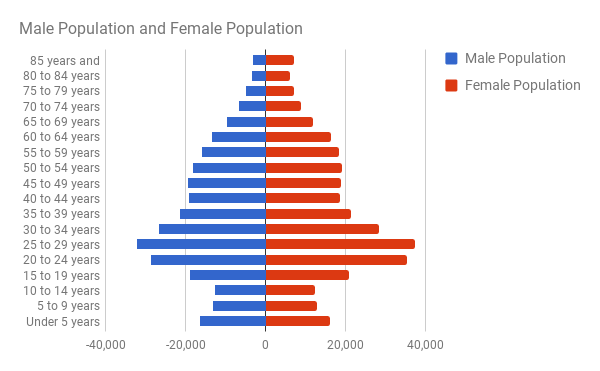
Washington DC, VA: Washington DC also possesses the trademark population bias in the 25-40 year range, most likely due to the large amount of infrastructure in the region and surplus of commuting jobs. Considering that this is the nation's capital, this region is primarily made of governmental agencies and tourism. Many individuals probably commute an hour or so a day from nearby cities in Virginia and Maryland to get to work. Mortality rates are about the same as the national average.
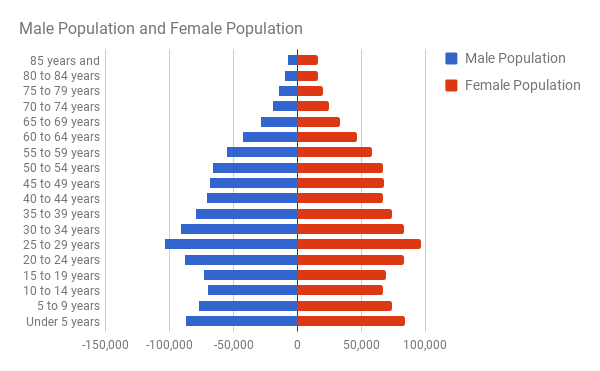
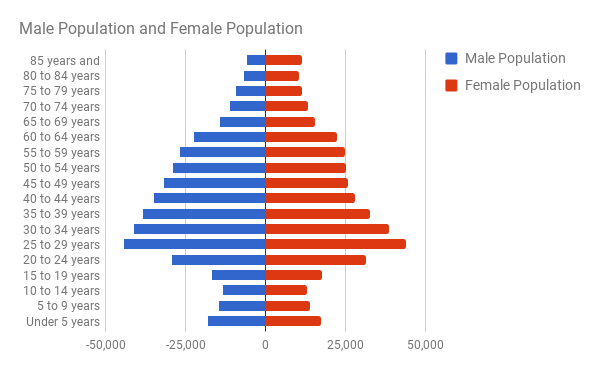
Houston, TX: Houston appears to possess a large amount of young individuals, unlike most large cities. This is probably due to the fact that Houston is made up of primarily poor and minority communities, both of which have high birth rates, thus accounting for this difference. There also appears to be a slight increase in mortality rate after the age of 60. This reflects upon the income of the inhabitants.
Interesting climate noaa images

This image shows average temperatures around the world with red colored regions representing above average temperatures and blue colored regions representing below average temperatures. Based upon this data, along a linear time scale, it is clear that overall temperatures are quite high, with greatest temperatures in northern hemisphere areas. This is interesting in that it shows how global temperatures have increased rapidly over time due to carbon emissions.
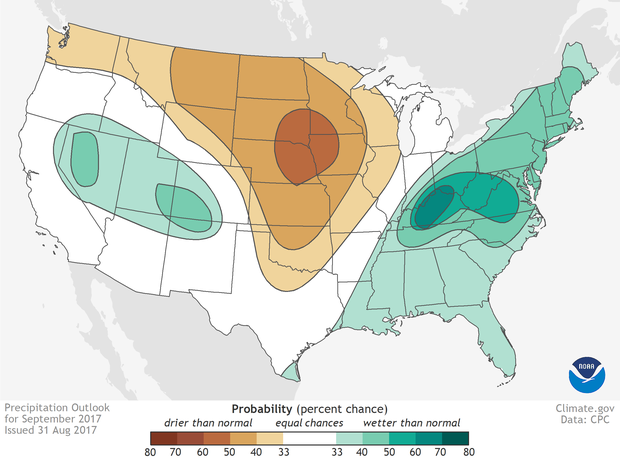
This data represents the monthly precipitation outlook around the United States. Based upon the given data, it becomes clear that orange regions are places where dry climate will be likely in the upcoming months. This is present in the northern part of the U.S. while the eastern part of the U.S. has a much higher probability of precipitation. The midwest is quite dry. This is interesting because it shows the risk of drought in California, a region that has experienced serious drought in the past few years and can not afford a loss of water.
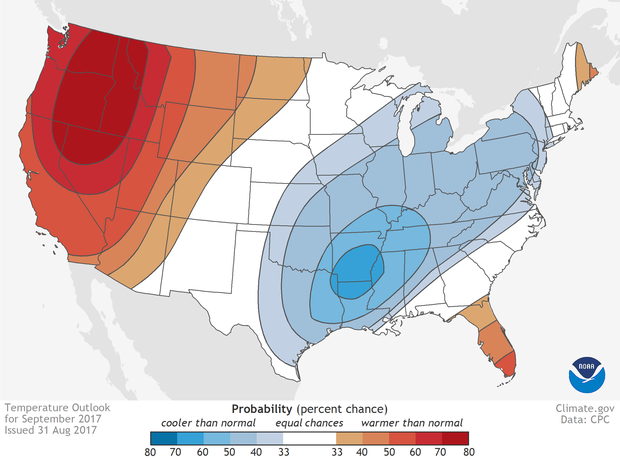
This image shows the tendency of high and low temperatures compared to historic monthly averages. It is clear that the western U.S. has quite high temperatures and the eastern U.S. has lower temperatures. This is interesting because it shows the climate in which severe hurricanes can form, especially along the Carribean.
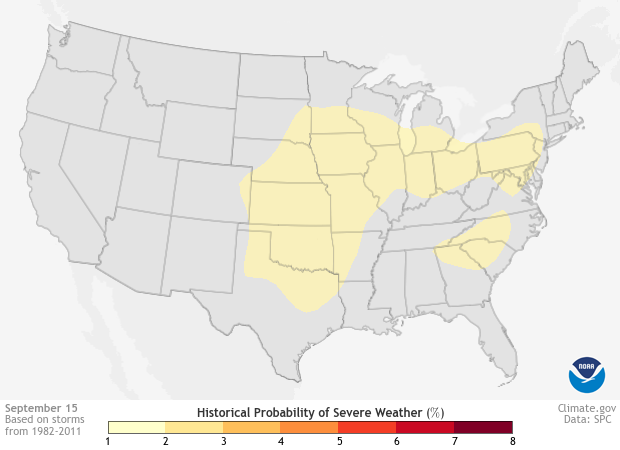
This image shows the distribution of severe weather throughout the United States, with the midwest being a region of high probability. This data is interesting because it shows how and where tornadoes will occur in the U.S., especially along tornado alley, a region starting in Texas and extending into Michigan. Strangely, this map does not show where hurricane concentration is high.

This image presents global oceanic temperatures around the world. It is clear that temperatures around Eastern Asia have risen substantially due to carbon emissions. In addition, temperatures in the Carribean have also increased substantially. It appears that temperatures increase as a result of ocean currents that transport warmer water west to east. This is interesting because it shows how high temperaures in the Carribean have contributed to greater hurricane intensity.
Feedback loop images & explanations
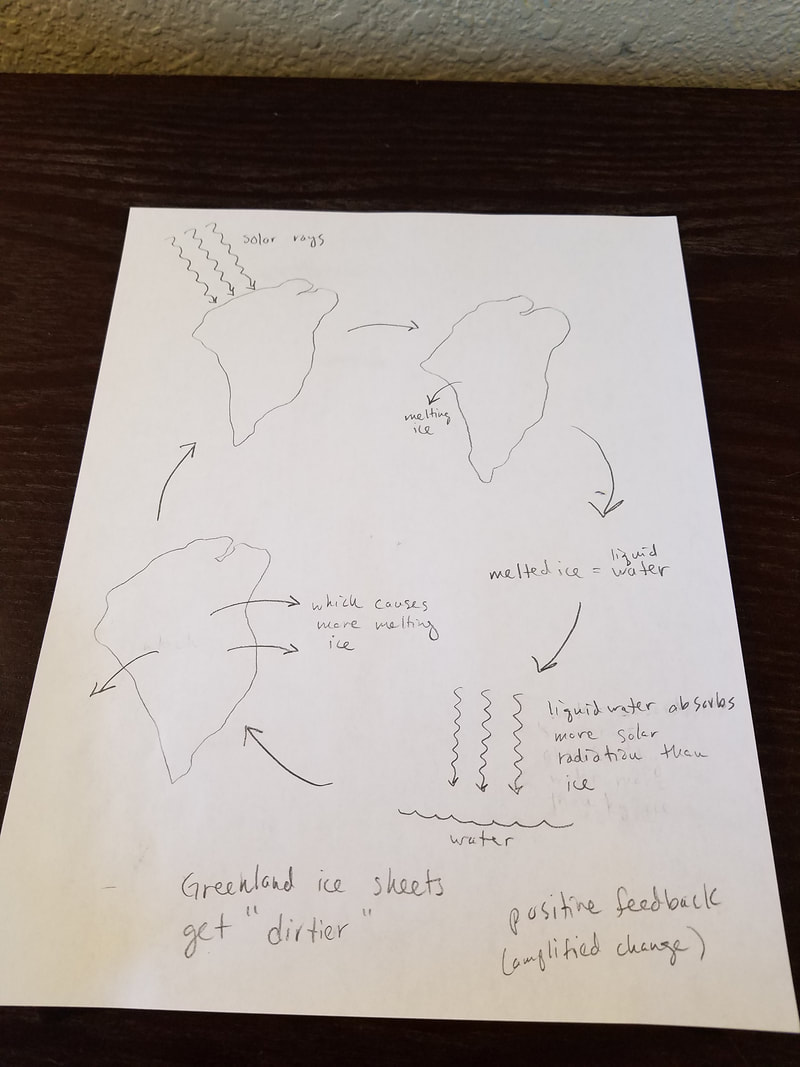
In this situation, it becomes clear that as global warming continues to melt more ice around the polar ice caps, ice will be converted into liquid water, which causes even greater light adsorption into the ice caps, because liquid water absorbs sunlight more effectively than than ice, due to the fact that ice reflects sunlight. As a result, this liquid water will warm up, causing even more ice to melt, thus accelerating the entire situation towards the melting of all of Greenland. This is positive feedback, because of the fact that this process promotes amplified change in one direction.
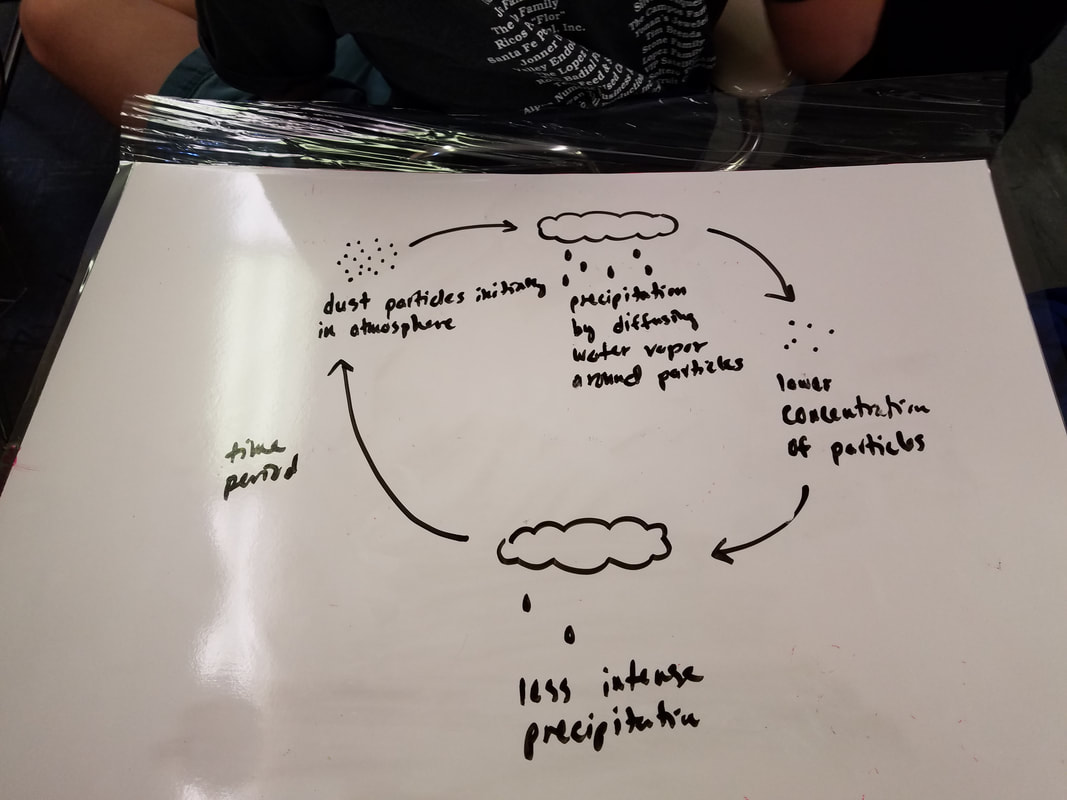
A rainy season would indicate that an abundance of particulates exist above the troposphere, thus promoting precipitation due to diffusion of water vapor around these particulates. As a result of heavy rains, the concentration of such particles present in the atmosphere would eventually decrease, thus decreasing the intensity of rainfall over time. Unless a source of these particulates is constant in the region, the rainfall will decrease until water vapor has nothing to form around, and raindrops will have a difficult time forming. This is negative feedback, because the entire system is accelerating in the opposing direction of where it started. As a result, change is this system is decreasing.
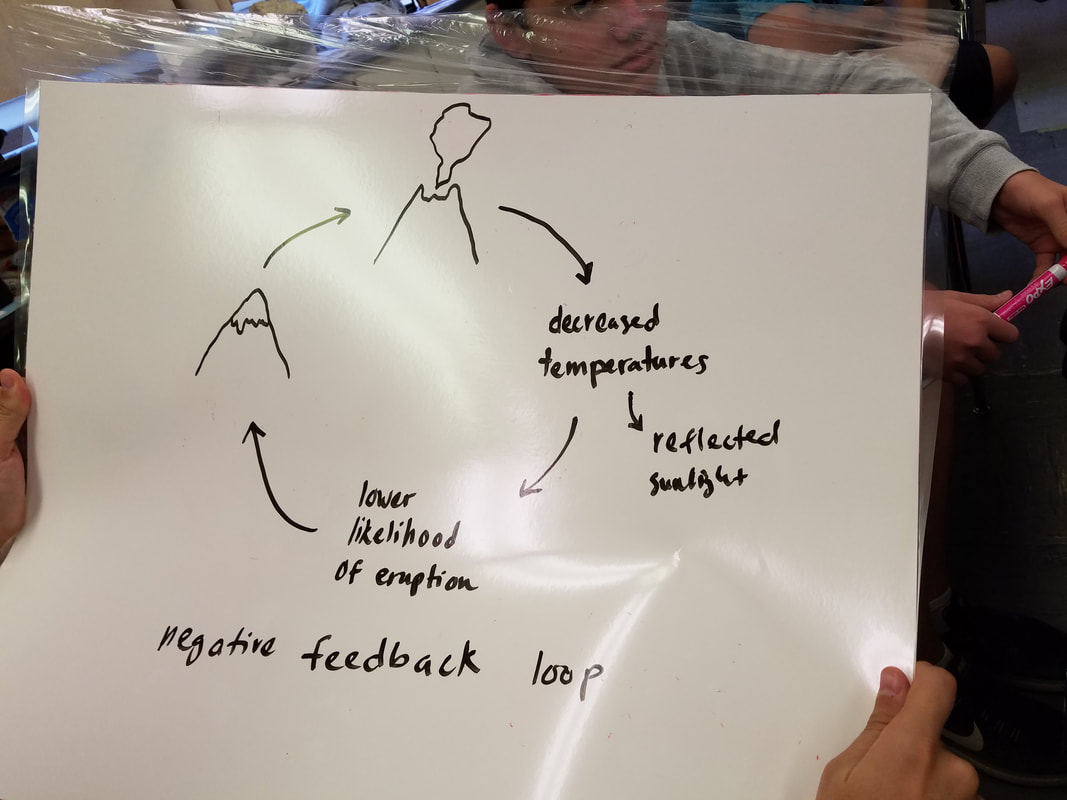
A volcanic eruption would cause decreased temperatures temporarily, but this does not contribute the the feedback cycle present in this system. After a volcanic eruption, the volcanic cone left behind as a result has to "refill" itself, for, without it, there is no opposing forces present against the force of magma within the volcano. If the volcano has just erupted, most of this pressure has been released, and it will be a long time before the volcano erupts again. This is a negative feedback loop, for the entire system is moving in a direction opposite to that which it started. In other words, this system is accelerating towards less overall change.
Species diversity lab: Staff vs. student parking lots
LINK TO GRAPHS!!!!!!!!
Prelab Questions:
1. Species Diversity Group 1
https://docs.google.com/spreadsheets/d/1Hj0cLIMcUMXEJ9Z5W2ZLq9fZzl24t9AArDF9wOW7mvQ/edit?usp=sharing
Species Diversity Group 2
https://docs.google.com/spreadsheets/d/1SgTMLFYLEIrHTWEUjPKzxwicGEjvRIQY4_ZXiypuC1U/edit?usp=sharing
2. I predict that the staff parking lot will be most diverse because of the fact that most high school students can not afford exotic and more diverse vehicles due to their economic status. Most students either buy used or cheap vehicles when they begin driving, and therefore, the variety of vehicles for students will be quite small.
Data Analysis:
1. Student parking lot Shannon Diversity Index: 2.41
Staff parking lot Shannon Diversity Index: 2.44
Work was computed automatically.
2. Student Parking Lot
https://docs.google.com/spreadsheets/d/1f-p9vQC9MrXsmGDK-KnGkdyIazfd5lWC6ARZ5pnWvWw/edit?usp=sharing
Staff Parking Lot
https://docs.google.com/spreadsheets/d/1LID12bK90BjcSVS4yHmEnI-OF7OTQXTIV2aPsWwAJQA/edit?usp=sharing
3. The Shannon Diversity Index is slightly higher for the staff parking lot than for the student parking lot.
Postlab Questions:
1. From the collected data, it appears that the parking lots are approximately equal in diversity. While the Shannon Diversity Index was slightly higher for the staff parking lot, the difference of 0.03 is very small. Based upon collected data and observations, it appears that while the student parking lot possessed a greater number of species, (20 different brands of cars in the student lot vs. 15 brands for the staff lot) the student lot possessed individual cars within those brands in much greater number. For instance, the student lot had 22 Chevrolet's which was the most abundant vehicle in the lot, while the staff lot had only 9 Ford's, which was the most abundant brand for that lot. Obviously, the student lot was much larger as well. Even so, the great number of repeats in the student lot did not increase the total Shannon Diversity Index, but in fact, sort of skewed the data, making it appear as though the staff parking lot was more diverse and had a greater number of brands, which it did not. So, technically, if one were to base diversity solely on the number of brands present, then my prediction was wrong. The student lot would be more diverse. Even so, the Shannon Diversity Index supports my claim.
2. As stated previously, the most abundant "species" or brand in the student parking lot was Chevrolet, with 22 being present in total. Toyotas, at 18, were a close second. In the staff parking lot, the most abundant brand was Ford, with 9 vehicles of this brand. To substantiate a reason for the abundances present among this data, one should look at cost. With a quick online search, the average cost of a Chevy is around $26,000. Ford's cost around $33,560 on average. This difference in price obviously accounts for the abundance of vehicles in each lot. Student's tend to have less money or parents tend to spend less on a first vehicle for a beginning driver. Adults, on the other hand, tend to have steady wages and are already on their second to forth vehicle. They will tend to spend more on these vehicles.
3. The max value in the student parking lot was 0.1946 and the min value was 0.0088. The max value for the staff parking lot was 0.169 and the min value was 0.0188.
4. If this experiment were conducted in a shopping mall parking lot, the Shannon Diversity Index would be higher, due to an even larger variety of vehicles present. It might not be much larger that the school's student lot though, due to the fact that only about four to five brands of cars rule the market. In fact, if all of the vehicles were repeats, say, Toyota Corollas, then the Shannon Diversity index would be quite low.
5. The answer to this question depends upon whether or not this new car dealership sells only one brand or multiple brands. If it only sold one brand, then the Shannon Diversity Index would be 1. If it sold multiple brands, then the value would probably be quite similar to that of the school parking lot. Once again, since only about four to five brands rule the market, and all vehicles are present by number in approximately equal proportion, then the Shannon Diversity index will be the same for most samples taken.
wooly worms lab (oct. 31, 2017)
Wooly worms conclusion:
a. Considering that the total number of events observed was seven, the total degrees of freedom were equal to six.
b. no b
c. The calculated chi-square value was 40.06, which is reflective of how random the selection of worms was for the entire class and the approximation between predicted and actual values. This helps to predict the overall derivation of collected data from being statistically significant.
d. According to the collected data, it becomes clear that the worms were not collected by chance, considering that the probability for the data, according to the chi-square value, is over 0.05 chance probability. This is indicative of the fact that chance did not play a part in determining the order of type of worms collected.
e. Bright colored worms that did not blend in with their surroundings, such as green worms on dirt or red worms on grass, were exerted upon by negative selection pressure. Worms that were exerted upon by positive selection pressure possessed camouflage that aided them in hiding from oncoming predators.
f. These results indicate that a certain variety of worms, those that possess camouflage capabilities, will survive longer than the rest of the population, reproduce, and become the dominant species among all of the worms.
g. If a particular bird possessed certain traits that provided it with an advantage or disadvantage in comparison to the other birds, this would have the effect of leaving certain worms varieties out of the selection process for the reason that they are simply too difficult to find. For instance, if the predator had a feeding time in the day, they would obviously be more prone to finding brightly colored worms, rather than the dark ones. This is the same for predators that can and cannot see color. Color blindness would contribute to capturing of worms of greater physical size to be eaten first. The only variety of bird that would have a chance at consuming small green worms, which hide and blend in with the grass, would be those with exceptional visual acuity. In almost all cases, the quality of eyesight among the birds is the main determining factor in terms of worm selection.
h. If these worms were left undisturbed, without predators, their relative populations would most likely remain constant. If predators were to be introduced, the populations found in this region would be much different. Only species with special characteristics that cloak the body of the worm would be successful in surviving any period of time to reproduce. This would fundamentally change the diversity within the population and lead to a decrease in the overall number of species.
